
August 7, 2026
Most pest control operators track two numbers to gauge route performance: stops completed and revenue booked.
Both metrics can look healthy on a given day while the route itself is losing money through drive-time gaps, an unbilled callback, a declined card, or overhead costs that never get allocated back to the stops responsible for covering them.
This article breaks down the true cost of running a pest control route in 2026, calculated at the daily, monthly, and per-stop level, and positions pest control business software as what it actually is: one line item in that cost structure, and one of the only tools capable of surfacing exactly where margin is being lost.
Pest Control Business Software and the Real Cost of Running a Route in 2026
Two routes can generate identical monthly revenue and still produce very different profit. Route density, callback rate, and how consistently customers pay all shape the outcome long before overhead or software costs enter the picture.
Below, we walk through the seven cost categories for every route, build a complete cost table at the daily, monthly, and per-stop levels, and show operators how to calculate the true cost of their routes.
Key Takeaways
- The real cost of a pest control route includes labor, vehicles, materials, insurance, software, office overhead, payment fees, and lost capacity.
- Cost per completed stop provides a clearer measure of route profitability than revenue alone.
- Route density, drive time, cancellations, and callbacks can cause two routes with similar revenue to produce very different margins.
- Pest control business software can reduce operating costs through route optimization, automated scheduling, field reporting, invoicing, and payment tracking.
- Route costs should be reviewed regularly because wages, fuel, service mix, and overhead change over time.
Know What Every Route Is Really Costing
PestBase connects scheduling, field activity, customer records, invoicing, and reporting so you can identify costly inefficiencies and protect route margins.
Unlock Smarter Pest Control Operations
5 Common Signs Your Pest Control Routes Are Becoming Too Expensive
Your routes may be costing more than you realize if you're experiencing any of these common issues:
| If You Notice... | It Could Mean... |
|---|---|
| Technicians regularly work overtime, but revenue stays the same. | Excess drive time, poor route density, or inefficient scheduling is reducing productivity. |
| Fuel and vehicle expenses continue to rise. | Routes may include unnecessary travel, inefficient sequencing, or large service gaps. |
| Frequent cancellations leave empty appointment slots. | Schedules aren't being optimized to fill gaps with nearby jobs. |
| Callbacks and repeat visits are increasing. | Service quality issues or incomplete customer information may be adding unnecessary costs. |
| You can't explain why one route is more profitable than another. | You're likely tracking revenue without measuring route costs, mileage, labor, and callbacks together. |
What Counts as the Cost of Running a Pest Control Route?
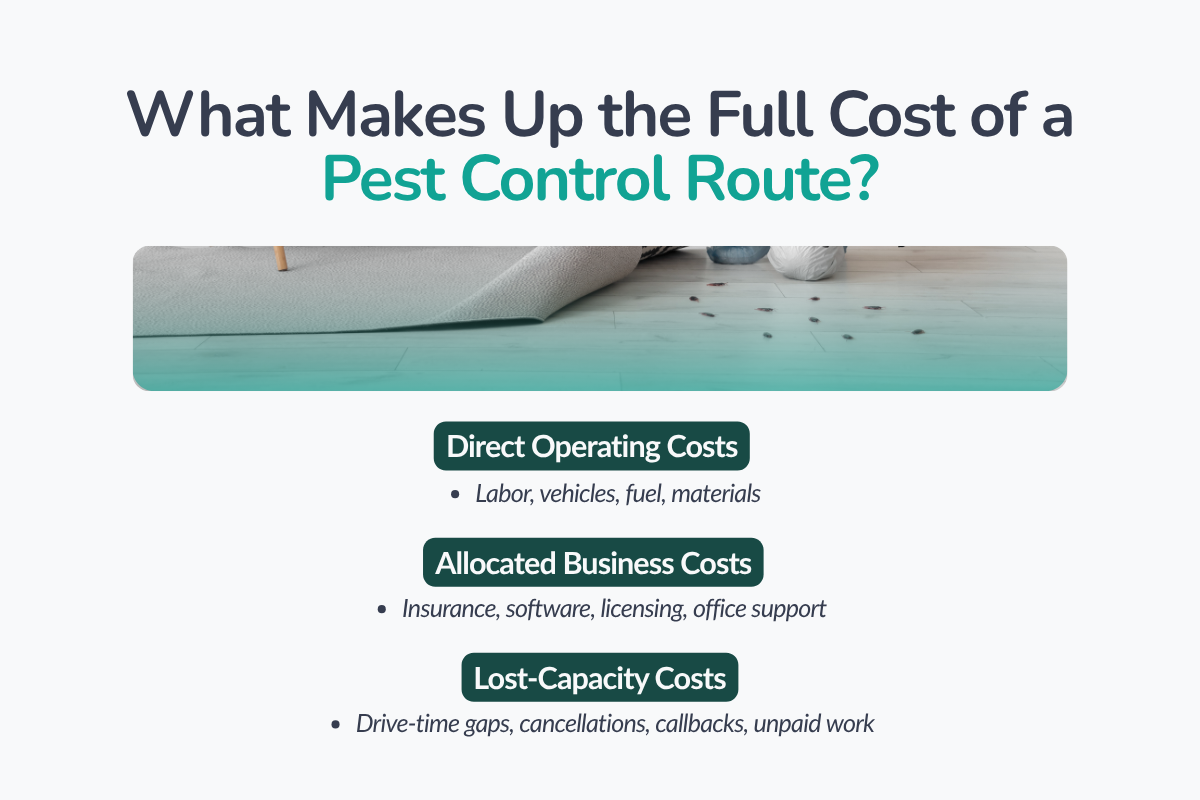
The cost of a pest control route includes every expense required to schedule, complete, document, and collect payment for its service visits. These costs fall into three categories:
- Direct costs: Technician labor, vehicle usage, fuel, pesticides, equipment, and disposable materials.
- Allocated overhead: Insurance, licensing, pest control software, office operations, administration, and equipment depreciation.
- Cost leakage: Drive-time gaps, cancellations, callbacks, unpaid invoices, and other work that consumes resources without generating additional revenue.
The basic calculation is:
Total Route Cost = Direct Costs + Allocated Overhead + Cost Leakage
A route generating high revenue is not necessarily profitable. Pest control companies must account for all three cost categories and divide them across completed stops to understand what each route actually contributes to the business.
Real Pest Control Route Cost Breakdown for 2026
Ask what a pest control route costs, and the first answers are usually technician wages, fuel, and chemicals. Those are the visible expenses. The harder costs to identify are paid drive time, vehicle depreciation, office support, free callbacks, and gaps in the schedule.
A useful route-cost calculation needs to capture both.
1. Technician Labor
Start with the technician’s fully loaded hourly cost, not just the wage shown on their pay stub. Payroll taxes, workers’ compensation, benefits, paid leave, training, and overtime all increase the business's spending per working hour.
The calculation must also cover the entire route day. A technician may complete paid services for only six hours but still be paid for eight. The remaining time may be spent driving, loading supplies, updating service records, or waiting between appointments.
2. Vehicles and Drive Time
Fuel receipts do not show what the vehicle actually costs the business. Lease payments or depreciation, commercial auto insurance, repairs, tires, registration, and equipment storage also belong in the calculation.
Drive time is particularly expensive because the company is paying for both the vehicle and the technician without completing another service. Two routes can produce the same revenue, but the one covering fewer miles between customers will usually retain more of it.
3. Pesticides, Equipment, and Field Supplies
Material costs should be recorded by service type rather than averaged across every job. A routine residential visit may use relatively little product, while termite work, rodent control, or a commercial account can require more equipment, materials, and technician time.
The calculation should also capture PPE, damaged equipment, expired products, spills, and other forms of inventory waste. Individually, these expenses may look minor. Across hundreds of service visits, they can materially affect the margin.
4. Insurance, Software, and Office Overhead
A route depends on more than the technician and service vehicle. It also uses the company’s insurance, licenses, pest control business software, phones, scheduling support, invoicing, bookkeeping, and office resources.
These expenses may be paid monthly or annually, which makes them easy to separate from daily route performance. However, they still need to be allocated across the routes they support. Otherwise, the reported cost per stop will appear lower than what the business actually spends.
5. Callbacks and Lost Capacity
This is where a route can look busy without being profitable. A free callback uses another appointment slot, more technician time, additional mileage, and sometimes more product.
Cancellations, no-access visits, scheduling gaps, and unbilled additional work create similar losses.
These costs are easy to miss because they may not appear as separate transactions. Measuring them is necessary to understand why some routes consistently produce weaker margins despite carrying plenty of customers.
What One Pest Control Route Costs per Day, Month, and Stop?
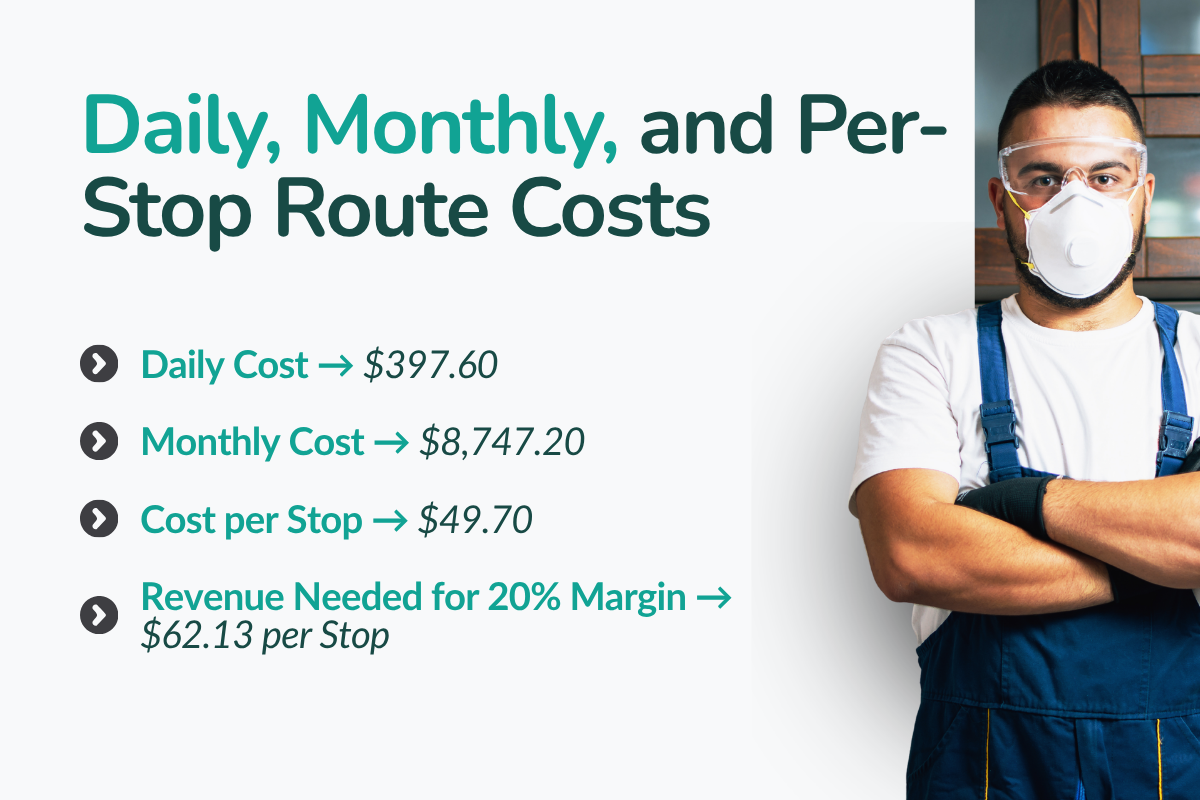
To put numbers around the calculation, consider a residential route with one technician working 8 paid hours, completing 8 stops, and driving 60 miles per day, operating 22 days per month.
In this example, we have used a loaded labor rate of $27 per hour. That starts with the national median wage of $21.51 reported by the BLS and adds an illustrative 25% for employer payroll costs and benefits.
You can replace Actual labor costs with your company’s own payroll data.
| Cost Category | Calculation | Daily Cost | Monthly Cost | Cost per Stop |
|---|---|---|---|---|
| Technician labor | $27 × 8 hours | $216.00 | $4,752.00 | $27.00 |
| Vehicle and mileage | 60 miles × $0.76 | $45.60 | $1,003.20 | $5.70 |
| Pesticides and materials | $7 × 8 stops | $56.00 | $1,232.00 | $7.00 |
| Insurance, licensing, and compliance | Daily allocation | $15.00 | $330.00 | $1.88 |
| Software and communication tools | Daily allocation | $10.00 | $220.00 | $1.25 |
| Office administration and payments | Daily allocation | $35.00 | $770.00 | $4.38 |
| Callbacks and lost capacity | Approximate reserve | $20.00 | $440.00 | $2.50 |
| Total | $397.60 | $8,747.20 | $49.70 |
The vehicle calculation uses the IRS business mileage rate of $0.76 per mile effective July 1, 2026. Because that rate reflects both fixed and variable vehicle expenses, fuel, depreciation, maintenance, and commercial auto costs should not be added again to this example.
Similarly, payroll taxes and workers’ compensation are already included in the loaded labor rate. Avoiding this kind of double counting is important when combining expenses from payroll, accounting software, and pest control business software.
In this model, the route must generate at least $49.70 per completed stop to cover its operating costs. To retain a 20% operating margin, the required revenue rises to approximately $62.13 per stop:
Required Revenue per Stop = Cost per Stop ÷ (1 − Target Margin)
At an average of $55 per stop, this route would generate $9,680 per month and retain only about $933 under the model-a margin of less than 10%. At $65 per stop, it would generate $11,440 and retain approximately $2,693, producing a margin of about 23.5%.
The point is not that every pest control route costs exactly $49.70 per stop. It is that small differences in labor, mileage, pricing, and lost capacity compound quickly across 176 monthly visits.
Why Two Routes With the Same Revenue Can Produce Different Profits?
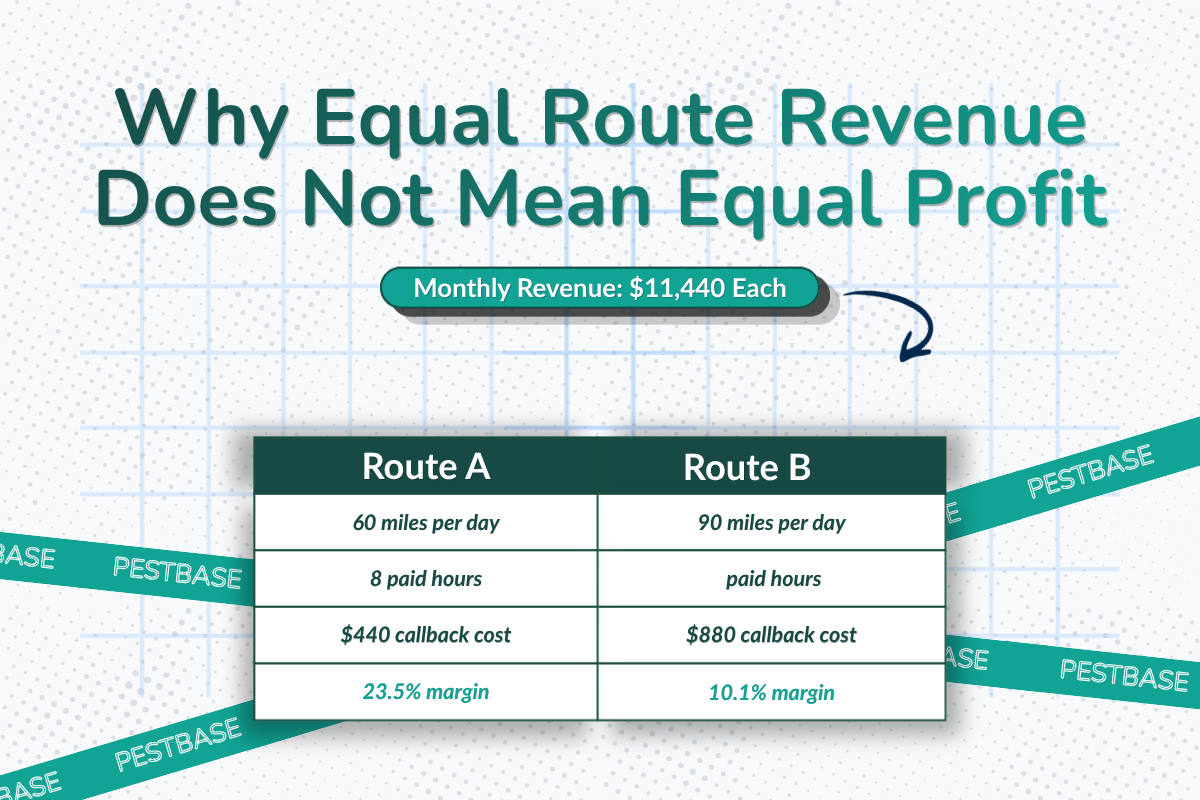
Revenue shows what a route brings in, but it does not show how much work and travel were required to earn it.
Consider two routes that each complete 176 paid visits at an average of $65 per stop. Both generate $11,440 per month. On paper, they look equally valuable, but operationally, they are very different.
| Route Metric | Route A: Dense and Efficient | Route B: Dispersed and Reservice-Heavy |
|---|---|---|
| Monthly revenue | $11,440 | $11,440.00 |
| Paid technician hours per day | $8 | $9.00 |
| Miles driven per day | 60 | $90.00 |
| Monthly callback allowance | $440 | $880.00 |
| Estimated monthly operating cost | $8,747 | $10,283.00 |
| Estimated operating surplus | $2,693 | $1,157.00 |
| Operating margin | 23.50% | 10.10% |
Route B does not have a revenue problem. It has a delivery-cost problem.
The additional 30 miles and one paid technician hour add nearly $1,100 per month before accounting for the higher callback rate. The same sales are being consumed by drive time, overtime, vehicle usage, and unpaid repeat visits.
Service mix can create similar differences. A commercial account or one-off termite job may produce more revenue per visit but require longer appointments and more materials. Recurring residential customers may have smaller invoices but become more profitable when they can be scheduled close together.
This is why route optimization is not simply about finding the shortest path on a map. It involves grouping compatible jobs, allowing realistic service times, reducing schedule gaps, and limiting repeat visits.
Pest control companies should compare routes using revenue per technician hour, miles per completed stop, cost per stop, and reservice rate. Revenue alone cannot show which route is actually contributing more to the business.
If rising fuel costs are eating into your profits, see how smarter route planning can reduce travel time and improve technician productivity.
How to Calculate and Track Your Own Route Costs?
Understanding your true route costs helps you identify inefficiencies, improve pricing decisions, and protect profitability. Instead of estimating expenses, use a consistent process to measure the actual cost of each route to your business.
To calculate your route costs:
- Start with one completed month and one route: Gather the technician's paid hours, completed visits, mileage, material usage, callbacks, cancellations, overhead allocation, invoiced revenue, and collected payments.
- Use completed, billable stops as your denominator: Calculating costs using scheduled jobs can underestimate your actual cost per route when cancellations or no-access visits occur.
- Calculate labor costs accurately: Multiply the technician's fully loaded hourly rate by every paid hour associated with that route.
- Measure vehicle costs consistently: Use either actual vehicle expenses or a mileage allowance—not both—to avoid double-counting.
- Track material usage based on actual consumption: This provides a more accurate picture of route profitability than estimated costs.
- Allocate overhead using a consistent method: Distribute expenses like insurance, software, licensing, and office support by route days, technician hours, or another fixed approach. Consistency matters more than choosing the "perfect" allocation method.
Once the costs are assembled, track these figures:
| Metric | Calculation | What It Reveals |
|---|---|---|
| Cost per completed stop | Total route cost ÷ completed billable stops | Minimum revenue required from each visit |
| Revenue per technician hour | Collected route revenue ÷ paid technician hours | Productivity of paid field time |
| Miles per stop | Total route miles ÷ completed stops | Route density and travel efficiency |
| Completion rate | Completed jobs ÷ scheduled jobs | Capacity lost to cancellations and no-access visits |
| Reservice rate | Free repeat visits ÷ completed visits | Cost of callbacks and service-quality issues |
| Operating margin | (Collected revenue − route cost) ÷ collected revenue | What the route retains after operating expenses |
Review scheduling, mileage, and completion data weekly so operational problems can be corrected quickly. Cost per stop and operating margin are better reviewed monthly, once payroll, invoices, payments, and overhead are complete.
Pest control business software can bring much of this data into one reporting system. If the information still lives across scheduling tools, payroll, spreadsheets, and accounting software, use the same route name or technician identifier in every system so the records can be matched accurately.
How Route Management Evolves as Pest Control Businesses Grow?
As a pest control business grows, the way it manages routes usually changes as well. What works for a handful of technicians often becomes difficult to maintain as more customers, vehicles, and recurring services are added. Most businesses move through three common stages before adopting a more connected operating model.
| Stage | How Routes Are Managed | What Starts to Happen |
|---|---|---|
| Stage 1: Whiteboards & Paper | Routes are planned manually using paper schedules or whiteboards. | Works for small teams but becomes difficult to update and track. |
| Stage 2: Spreadsheets | Routes, customers, and schedules are managed across spreadsheets and separate tools. | Manual updates, duplicate work, and disconnected information become common. |
| Stage 3: Pest Control Business Software | Scheduling, dispatch, customer records, invoicing, and reporting are connected in one platform. | Teams gain better visibility, reduce manual work, and improve route efficiency. |
How Pest Control Business Software Can Reduce Route Costs?
Software creates value only when it improves the way routes are planned, dispatched, completed, and monitored. Simply digitizing manual processes without improving workflows rarely reduces operating costs.
1. Improve Scheduling and Route Optimization
Pest control scheduling software can group nearby appointments, manage recurring visits, and assign jobs based on technician availability. When a cancellation occurs, the office can see which nearby job could fill the opening instead of leaving part of the route unused.
Better route optimization reduces both vehicle expenses and paid drive time. It can also help pest control companies complete more jobs without extending the technician’s workday.
2. Keep the Field and Office Connected
Technicians often lose time calling the office for customer details, treatment history, or schedule changes. A mobile app gives them access to this information while they are in the field.
They can update job status, record chemical use, add service notes, and document completed work without waiting until the end of the day. If the app works offline, those records can still be captured in areas with unreliable connectivity and synced later.
This reduces repeated data entry and gives office staff cleaner information for invoicing, customer follow-up, and compliance reporting.
3. Shorten the Time Between Service and Payment
When field records and office operations are disconnected, completed jobs may sit unbilled until someone transfers the information manually.
Pest control management software can generate invoices after service, manage recurring billing, send payment reminders, and accept online payments. A customer portal can also give customers direct access to invoices, service history, and payment options.
These tools do not remove processing fees, but they can reduce paperwork, unpaid invoices, and the time spent chasing payments.
4. Show Which Routes Are Actually Performing
A useful reporting dashboard should connect scheduled jobs with completed services, technician hours, mileage, materials, callbacks, invoicing, and collected revenue.
A QuickBooks integration can move financial information into the accounting system. However, accounting software alone may not explain why one route costs more to operate. That requires the scheduling, field service, and customer data held inside the pest control software.
The subscription should ultimately be judged against measurable savings. For example, reducing travel by 10 miles per day, saving two office hours per week, and preventing one unnecessary callback could recover roughly $390 per month under the cost assumptions used earlier.
The relevant calculation is:
Software Value = Operating Costs Avoided + Revenue Recovered − Total Software Cost
Before evaluating software costs, understand how time savings can translate into measurable revenue growth for your pest control business.
How Modern Operators Use PestBase to Protect Margins?
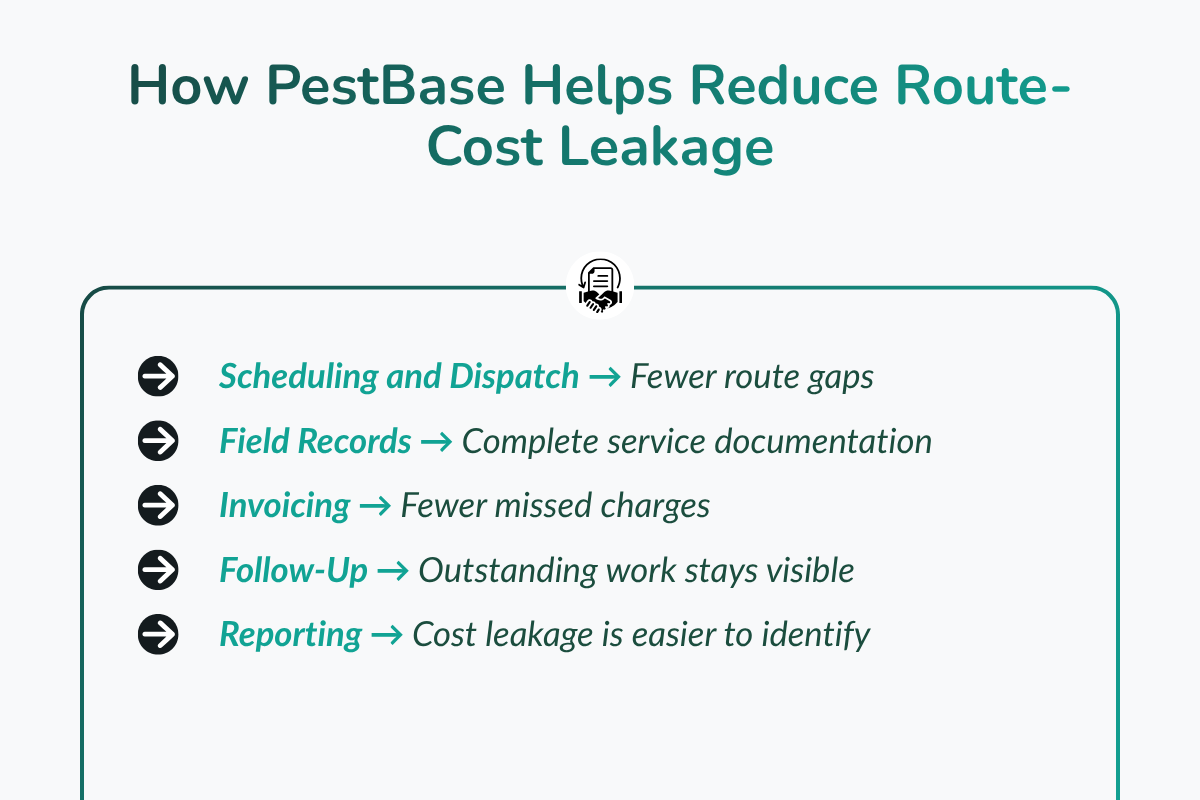
Route costs are difficult to track when sales, scheduling, field work, and billing operate in separate systems. PestBase connects these stages so information can move from the initial customer request to completed service and payment without repeated entry.
With PestBase, pest control companies can:
- Keep customer and service information together: Office teams and technicians work from the same job details and service history.
- Coordinate scheduling and dispatch: Jobs can be assigned without relying on separate calendars, messages, and spreadsheets.
- Support technicians in the field: Teams can access job information and record completed work as service happens.
- Move completed jobs into invoicing: Service data stays connected to billing, reducing delays and missed charges.
- Follow up on outstanding work and payments: Teams can see what still requires action instead of tracking it manually.
- Create a clearer operational record: Connected data makes it easier to identify scheduling gaps, repeated work, and other costs affecting route margins.
By reducing manual handoffs between the office and field, PestBase helps pest control businesses spend less time managing disconnected tools and more time improving route performance.
The Bottom Line
A full calendar does not make a route profitable. Each completed stop must cover labor, mileage, materials, insurance, office support, software, payment fees, and the cost of callbacks or unused capacity.
The example in this article produced a break-even cost of $49.70 per stop, but every pest control business needs to calculate its own figure. Wages, route density, service mix, and overhead can change the result considerably.
Pest control business software is valuable when it makes those costs visible and reduces measurable waste. The goal is not simply to fit more stops into the schedule; it is to make each stop more profitable.
Stop Losing Margin Between the Schedule and the Invoice
PestBase connects scheduling, field work, customer records, invoicing, and follow-up so your team can reduce manual gaps and run more profitable routes.
Book a PestBase Demo and see how PestBase helps pest control businesses simplify daily operations, improve technician productivity, and turn every route into a more profitable one.
FAQs
How Much Does It Cost to Run a Pest Control Route?
The worked example in this article costs approximately $397.60 per day, $8,747.20 per month, or $49.70 per completed stop. Actual costs depend on wages, mileage, service mix, overhead, and route efficiency.
What Is the Largest Expense in a Pest Control Business?
Technician labor is typically one of the largest route expenses. The calculation should include payroll taxes, workers’ compensation, benefits, paid drive time, training, and other employment costs—not only the hourly wage.
How Do You Calculate Pest Control Cost per Stop?
Divide the route’s total operating cost by its completed billable stops: Cost per Stop = Total Route Cost ÷ Completed Billable Stops. Include direct expenses, allocated overhead, and costs from callbacks or unused capacity.
How Many Jobs Should a Pest Control Technician Complete per Day?
There is no universal target. The example uses eight completed stops, but the right number depends on travel distance, treatment type, property size, service time, and documentation requirements.
How Does Route Optimization Reduce Pest Control Costs?
Route optimization groups nearby jobs and reduces unnecessary mileage, drive time, schedule gaps, and overtime. This allows technicians to complete more paid work within the same working day.
How Much Does Pest Control Business Software Cost?
Entry-level pest control software can start around $30–$50 per month, while multi-user and custom platforms can cost several hundred dollars monthly. For example, Fieldwork publishes plans beginning at $49 per user per month. Compare the full cost, including setup, users, messaging, integrations, payment processing, and add-ons.
What Is the Best Pest Control Software for Managing Route Costs?
The best pest control software connects scheduling, field records, route activity, invoicing, payments, and reporting. It should reveal cost per stop and route performance while saving more through reduced travel and administration than it costs to operate.